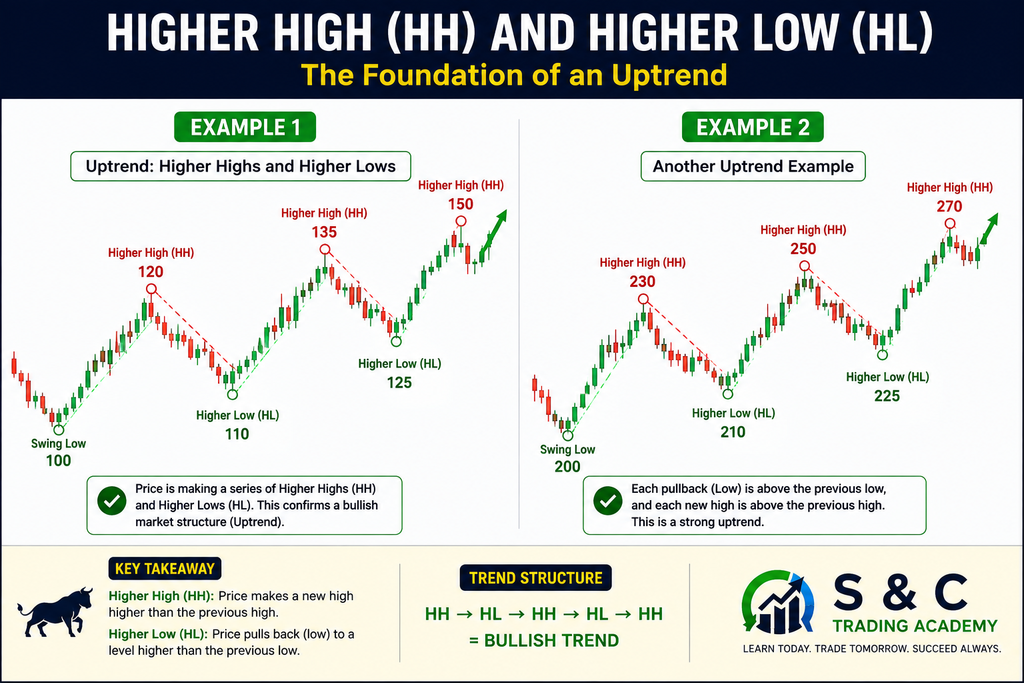
Understanding market structure is one of the most important skills for anyone learning technical analysis. Before entering a trade, traders need to understand whether a stock is trending upward, trending downward, or moving sideways.
Instead of looking at every candle individually, market structure helps you understand the bigger picture.
A simple way to think about it is:
Higher Highs + Higher Lows = Uptrend
Lower Highs + Lower Lows = Downtrend
Similar Highs + Similar Lows = Range/Sideways Market
Once you learn how to identify these patterns, reading a stock chart becomes much easier.
In this guide, we’ll explain how to read market structure on a stock chart, how to identify higher highs and lower lows, understand trend changes, spot breakouts and reversals, and avoid common market-structure mistakes.
Disclaimer: This article is for educational purposes only and should not be considered investment or trading advice. Stock market trading involves risk, and no strategy guarantees profits.
What Is Market Structure in Trading?
Market structure refers to the way price moves on a chart through its swing highs and swing lows.
Instead of focusing on every small candle, traders identify important points where price changes direction.
For example:
₹100 → ₹110 → ₹105 → ₹120 → ₹112 → ₹130
The important points are:
₹100 = Swing Low
₹110 = Swing High
₹105 = Higher Low
₹120 = Higher High
₹112 = Higher Low
₹130 = Higher High
This tells us that the stock is creating a series of higher highs and higher lows.
That is an example of bullish market structure.
Why Is Market Structure Important?
Market structure gives traders a framework for understanding price direction and potential changes in trend.
It can help you identify:
Uptrends
Downtrends
Sideways markets
Potential trend reversals
Breakouts
Breakdowns
Support and resistance areas
Entry opportunities
Stop-loss locations
Areas where a trend may weaken
Most importantly, market structure helps you avoid trading against the broader price movement without a clear reason.
The 4 Basic Components of Market Structure
To understand market structure, you first need to learn four simple terms.
1. Higher High (HH)
A Higher High occurs when price moves above a previous significant swing high.
Example:
₹100 → ₹115 → ₹108 → ₹125
Here:
Previous high = ₹115
New high = ₹125
Because ₹125 is higher than ₹115, it is a Higher High.
HH = Higher High
2. Higher Low (HL)
A Higher Low occurs when price pulls back but finds support above the previous significant low.
Example:
₹100 → ₹120 → ₹110 → ₹130
Here:
Previous low = ₹100
New pullback low = ₹110
Because ₹110 is higher than ₹100, it is a Higher Low.
HL = Higher Low
3. Lower High (LH)
A Lower High occurs when price attempts to move higher but fails to reach the previous significant high.
Example:
₹150 → ₹130 → ₹140 → ₹120
Here:
Previous high = ₹150
New high = ₹140
Because ₹140 is below ₹150, it is a Lower High.
LH = Lower High
4. Lower Low (LL)
A Lower Low occurs when price falls below a previous significant swing low.
Example:
₹150 → ₹130 → ₹140 → ₹120
Here:
Previous low = ₹130
New low = ₹120
Because ₹120 is below ₹130, it is a Lower Low.
LL = Lower Low
The Basic Market Structure Formula
You can remember market structure with this simple framework:
Bullish Structure
HH → HL → HH → HL → HH
Higher highs and higher lows.
Bearish Structure
LL → LH → LL → LH → LL
Lower lows and lower highs.
Sideways Structure
Resistance → Range → Support → Range
Price moves between relatively defined boundaries.
This is the foundation of market structure trading.
How to Identify an Uptrend
An uptrend occurs when buyers are consistently pushing price to higher levels.
Look for:
Higher High → Higher Low → Higher High → Higher Low
For example:
Low = ₹100
High = ₹120
Pullback = ₹110
New high = ₹135
Pullback = ₹125
New high = ₹145
The structure is:
HH + HL + HH + HL + HH
This indicates bullish price structure.
What traders may look for
During an uptrend, traders may pay attention to:
Pullbacks toward previous support
Higher-low areas
Breakouts above previous highs
Bullish price-action setups
However, the exact entry should depend on the trader’s strategy.
How to Identify a Downtrend
A downtrend occurs when sellers are consistently pushing price lower.
Look for:
Lower Low → Lower High → Lower Low → Lower High
Example:
High = ₹200
Low = ₹180
Bounce = ₹190
New low = ₹165
Bounce = ₹175
New low = ₹150
The structure is:
LL + LH + LL + LH + LL
This indicates bearish market structure.
Traders may then watch for:
Lower-high areas
Breakdowns below previous lows
Bearish price action
Pullbacks toward resistance
What Is a Sideways Market Structure?
Not every stock is trending.
Sometimes price moves inside a range.
For example:
Resistance = ₹500
Support = ₹450
Price repeatedly moves:
₹450 → ₹500 → ₹460 → ₹495 → ₹455 → ₹500
There is no clear sequence of higher highs and higher lows or lower highs and lower lows.
This is known as a sideways or range-bound market.
During such conditions, trend-following strategies may produce weaker signals.
This is why identifying the market environment before entering a trade is important.
How to Read Market Structure Step by Step
Now let’s make the process practical.
Step 1: Start With a Higher Timeframe
Don’t immediately zoom into a 5-minute chart.
Start with a larger timeframe such as:
Weekly
Daily
4-hour
1-hour
The appropriate timeframe depends on your trading style.
For example:
Swing trader
May start with the weekly or daily chart and then move to lower timeframes.
Intraday trader
May use the daily chart for context and a lower timeframe for execution.
The goal is to understand the broader structure first.
Step 2: Identify Major Swing Highs and Lows
Look for obvious points where price changed direction.
Ask:
Where did buyers take control?
Where did sellers take control?
You don’t need to mark every tiny candle movement.
Focus on the meaningful swing points.
Step 3: Connect the Swing Points
Now compare the highs and lows.
Ask:
Are highs getting higher?
If yes, bullish pressure may be developing.
Are lows getting higher?
If yes, buyers may be defending higher levels.
Are highs getting lower?
This can indicate weakening buying pressure.
Are lows getting lower?
This can indicate stronger selling pressure.
Step 4: Determine the Current Structure
After identifying the swing points, classify the market.
HH + HL
Bullish
LH + LL
Bearish
Repeated highs and lows
Sideways/Range
This simple classification can dramatically improve chart reading.
Step 5: Look for Structure Changes
Market structure isn’t permanent.
An uptrend can become a downtrend.
A downtrend can become an uptrend.
A sideways market can begin trending.
That’s why traders need to monitor changes in swing structure.
What Is Break of Structure (BOS)?
Break of Structure (BOS) is a term used by many price-action traders to describe price breaking an important previous swing point.
For example, imagine a stock is creating:
HH → HL → HH → HL
Then price breaks below an important previous higher low.
That may indicate that the bullish structure is weakening.
Similarly, during a downtrend:
LL → LH → LL → LH
If price breaks above a significant lower high, it may indicate a potential shift in structure.
A BOS should be interpreted within the broader chart context rather than treated as an automatic buy or sell signal.
What Is Change of Character (CHoCH)?
Change of Character (CHoCH) is another term commonly used in price-action and market-structure analysis.
It generally describes an early sign that the existing market structure may be changing.
For example:
Existing bullish structure
HH → HL → HH → HL
Then price breaks an important higher low.
Some traders may interpret this as a potential bearish change of character.
Likewise, if a bearish market begins breaking important lower highs, traders may consider a potential bullish change.
Important:
CHoCH is not a guarantee of a trend reversal.
It is better viewed as a possible warning that the existing structure is changing.
Break of Structure vs Change of Character
Feature
Break of Structure
Change of Character
Main purpose
Identifies a structural break
Highlights potential change
Focus
Existing trend structure
Possible trend transition
Use
Trend continuation or confirmation
Early reversal observation
Reliability
Depends on context
Requires additional confirmation
Best used with
Price action and key levels
Volume, support/resistance and trend
Different traders and educational frameworks can use these terms differently, so always understand the definitions used by your strategy.
Market Structure and Support & Resistance
Market structure becomes even more useful when combined with support and resistance.
For example, imagine a stock is in an uptrend:
HH → HL → HH → HL
The higher-low areas may overlap with important support zones.
If price pulls back into one of these areas and shows bullish confirmation, traders may watch it closely.
Likewise, in a downtrend, lower-high areas may overlap with resistance.
This creates a more structured way to analyze price.
Market Structure and Trend Lines
Trend lines can also help visualize market structure.
In an uptrend, traders may connect important higher lows.
In a downtrend, traders may connect important lower highs.
However, don’t rely on a trend line alone.
A trend line can break while the broader market structure remains intact.
Use:
Trend Line + Swing Points + Support/Resistance + Price Action
for a broader view.
Market Structure and Volume
Volume can provide additional context.
Suppose price breaks above a major swing high.
If volume also increases, it may indicate stronger market participation.
On the other hand, a breakout with weak participation may require more caution.
Volume should not be used alone.
A better approach is to combine:
Market Structure + Price + Volume
Example of Bullish Market Structure
Imagine a stock moves like this:
₹100 → ₹120 → ₹110 → ₹135 → ₹125 → ₹150
Let’s identify the structure:
₹100 = Initial low
₹120 = Higher High
₹110 = Higher Low
₹135 = Higher High
₹125 = Higher Low
₹150 = Higher High
The pattern is:
HH → HL → HH → HL → HH
This is a classic bullish structure.
Example of Bearish Market Structure
Now imagine:
₹200 → ₹180 → ₹190 → ₹165 → ₹175 → ₹150
The structure becomes:
₹200 = Initial high
₹180 = Lower Low
₹190 = Lower High
₹165 = Lower Low
₹175 = Lower High
₹150 = Lower Low
The pattern is:
LL → LH → LL → LH → LL
This indicates bearish market structure.
How Market Structure Can Help With Entries
Market structure can help traders understand where a setup fits within the overall price movement.
For example, a trader might wait for:
A clear uptrend
A pullback
Formation of a higher low
Bullish confirmation
Defined stop-loss
Suitable risk-to-reward
This is generally more structured than buying simply because a candle turns green.
How Market Structure Can Help With Stop-Loss Placement
Market structure can also provide logical reference points for risk management.
For example, if a trader takes a bullish setup around a higher-low area, the stop-loss might be considered below a relevant swing low according to the trader’s strategy.
Similarly, for a bearish setup, a trader may consider a stop above a relevant lower-high area.
The exact stop-loss should depend on the setup, volatility, timeframe, and risk-management rules.
Common Market Structure Mistakes
Mistake 1: Marking Every Tiny Swing
Charts can become confusing when every small movement is labeled.
Better approach:
Focus on significant swing highs and lows.
Mistake 2: Looking at Only One Timeframe
A stock may look bullish on a 5-minute chart but bearish on a daily chart.
Better approach:
Check the broader timeframe before making a decision.
Mistake 3: Assuming Every Breakout Is a Trend Reversal
One candle breaking a level doesn’t necessarily mean the entire trend has changed.
Better approach:
Wait for additional structure confirmation.
Mistake 4: Ignoring Sideways Markets
Traders sometimes force an uptrend or downtrend onto a range-bound chart.
Better approach:
If highs and lows aren’t clearly progressing, consider whether the stock is simply ranging.
Mistake 5: Entering Because of One Candle
One large green candle can be exciting.
But market structure is about multiple swing points, not one candle.
Mistake 6: Ignoring Risk Management
Even perfect market-structure analysis can be wrong.
Always define:
Entry
Stop-loss
Position size
Exit strategy
Maximum acceptable risk
before taking a trade.
A Simple Market Structure Checklist
Before analyzing a stock, ask:
☐ What is the higher-timeframe trend?
☐ Where are the major swing highs?
☐ Where are the major swing lows?
☐ Are highs getting higher or lower?
☐ Are lows getting higher or lower?
☐ Is the market trending or ranging?
☐ Has an important structure level been broken?
☐ Is there a potential change in structure?
☐ Where are the key support and resistance zones?
☐ Is volume supporting the move?
☐ Does the setup match my trading strategy?
☐ Where would the trade idea become invalid?
This checklist can help make chart analysis more systematic.
Market Structure for Intraday Traders
Intraday traders can use market structure on shorter timeframes, but context remains important.
For example:
Step 1
Check the daily chart.
Step 2
Identify the broader trend.
Step 3
Move to the 15-minute or 5-minute chart.
Step 4
Identify intraday swing highs and lows.
Step 5
Wait for a setup that matches your trading plan.
This approach can help prevent traders from taking every small intraday movement as a major trend.
Market Structure for Swing Traders
Swing traders often work with larger price movements.
A possible workflow is:
Weekly Chart → Daily Chart → Entry Timeframe
For example:
Weekly = broader trend
Daily = market structure
1-hour = entry setup
The exact combination depends on the trader’s strategy.
Market Structure vs Indicators
One advantage of market structure is that it focuses directly on price movement.
Indicators such as:
RSI
MACD
Moving averages
Bollinger Bands
can provide additional information.
However, traders don’t necessarily need dozens of indicators.
can provide a strong framework for learning price action.
How Beginners Can Practice Market Structure
You don’t need to immediately risk real money.
Try this exercise.
Step 1
Open a historical stock chart.
Step 2
Hide the most recent part of the chart.
Step 3
Mark the swing highs and lows.
Step 4
Label:
HH / HL / LH / LL
Step 5
Identify the trend.
Step 6
Move the chart forward.
Step 7
See whether your market-structure reading made sense.
Repeat this exercise with different stocks and timeframes.
Over time, recognizing structure can become much more natural.
🎯 The Simple Formula to Remember
If you remember nothing else from this article, remember this:
Bullish Market Structure
Higher High + Higher Low
Bearish Market Structure
Lower High + Lower Low
Sideways Market
Price remains within a range
Potential Structure Change
Important swing level gets broken
That’s the foundation of reading market structure on a stock chart.
🎓 Learn Technical Analysis With S&C Trading Academy
Understanding market structure is an important part of technical analysis.
At S&C Trading Academy, traders and beginners can learn concepts such as:
Market structure
Price action
Candlestick patterns
Support and resistance
Trend lines
Volume analysis
Chart patterns
Intraday trading
Swing trading
Risk management
Trading psychology
Our share market classes in Chennai are designed to help learners understand stock market concepts through structured education and practical chart-based learning.
You can also explore the educational resources on tradingacademy.co.in to continue building your technical-analysis knowledge.
Final Thoughts
Learning how to read market structure on a stock chart can make technical analysis much easier.
Instead of asking:
“Should I buy this candle?”
Start asking:
“What is the market structure telling me?”
Look for:
Higher Highs → Higher Lows → Uptrend
or:
Lower Highs → Lower Lows → Downtrend
And when neither pattern is clear, recognize that the market may be sideways.
The goal isn’t to predict every market movement.
The goal is to understand the price structure, wait for quality setups, and manage risk when your analysis is wrong.
Read the structure. Wait for confirmation. Manage your risk.
Frequently Asked Questions
1. What is market structure in trading?
Market structure is the way price forms swing highs and swing lows on a chart. Traders use these movements to identify trends, ranges, and potential changes in market direction.
2. What are HH and HL in trading?
HH means Higher High, while HL means Higher Low. A sequence of higher highs and higher lows generally represents bullish market structure.
3. What are LH and LL in trading?
LH means Lower High and LL means Lower Low. A sequence of lower highs and lower lows generally represents bearish market structure.
4. How do you identify an uptrend?
Look for a sequence of higher highs and higher lows. The price should generally be progressing upward through its important swing points.
5. How do you identify a downtrend?
Look for lower highs and lower lows. This indicates that sellers are generally pushing price toward lower levels.
6. What is Break of Structure?
Break of Structure, or BOS, is a term commonly used by price-action traders when price breaks an important previous swing point. The interpretation depends on the broader market context.
7. What is CHoCH in trading?
CHoCH stands for Change of Character. It is commonly used to describe a possible early change in market structure. It should not be treated as a guaranteed trend reversal signal.
8. Can beginners use market structure?
Yes. Market structure is one of the foundational concepts of technical analysis. Beginners can start by learning to identify swing highs, swing lows, higher highs, higher lows, lower highs, and lower lows on historical charts.
Link this article to the following related blog posts: